Difference between revisions of "BBench"
m (→Results Page) |
m |
||
| Line 35: | Line 35: | ||
A. Gutierrez, R.G. Dreslinski, T.F. Wenisch, T. Mudge, A. Saidi, C. Emmons, and N. Paver. Full-System Analysis and Characterization of Interactive Smartphone Applications. ''IEEE International Symposium on Workload Characterization'', pages 81-90, Austin, TX, November 2011. | A. Gutierrez, R.G. Dreslinski, T.F. Wenisch, T. Mudge, A. Saidi, C. Emmons, and N. Paver. Full-System Analysis and Characterization of Interactive Smartphone Applications. ''IEEE International Symposium on Workload Characterization'', pages 81-90, Austin, TX, November 2011. | ||
| − | |||
| − | |||
Revision as of 16:00, 24 November 2011
BBench is a web-page rendering benchmark comprising 11 of the most popular sites on the internet today [Google]: Amazon, BBC, CNN, Craigslist, eBay, ESPN, Google, MSN, Slashdot, Twitter, and YouTube. The content for these sites was gathered using a tool called HTTrack. BBench automatically renders each of the aforementioned web-pages in an iterative fashion using a custom script written in JavaScript.
Contents
Running BBench
Since BBench is a collection of web-pages it consists of HTML, CSS, JavaScript, images etc. None of this code is compiled, instead it is interpreted by the browser as it renders the page. To run BBench download and untar the source, then, simply navigate to the BBench homepage in your browser. This is the index.html file in the top level directory of the BBench source. Opening the BBench homepage can usually be done by double clicking on the index.html file, or you can point your browser to this file manually by inserting the url into your browser, e.g., file:///path_to_bbench/index.html.
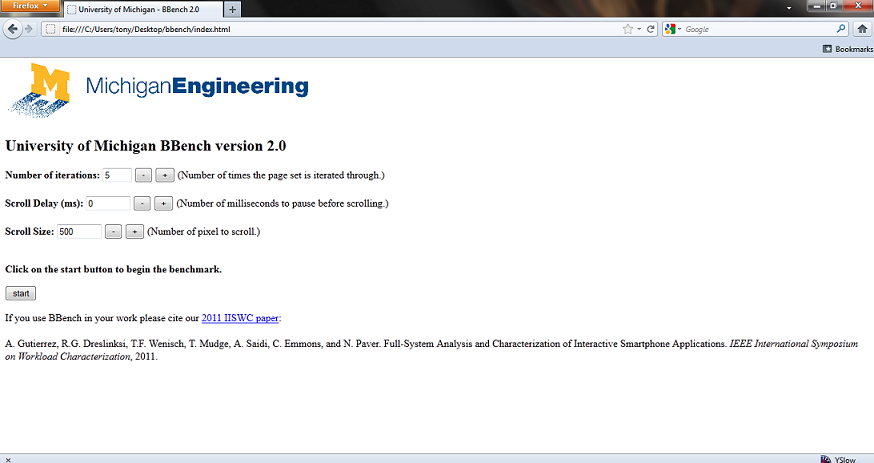
The start page allows you to configure several different options:
- Number of iterations: This is the number of times the web-pages will be rendered.
- Scroll delay: The number of milliseconds to wait before performing the next scroll operation.
- Scroll size: The number of pixels to scroll by.
Once the configuration options are set you may click on the start button to begin the benchmark.
Results Page
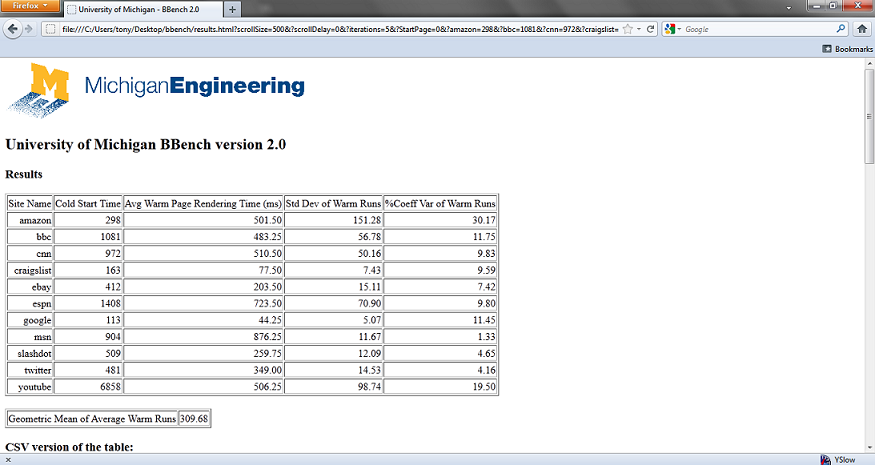
The results page displays the run-time statistics for each of the pages in the page set. The Cold Start Time column in table reports the rendering time for each page the first time it is rendered. The remaining columns in the table report statistics related to rendering time after the first iteration, or, the warm runs. The stats provided are the average page rendering time for each page in ms, the standard deviation of the rendering time, and the coefficient of variation of the rendering time as a percentage. The individual run-times for each page iteration are also presented.
Source
A tarball of the BBench source can be found here:
Android Full-System Files
Get a gem5 compatible Android kernel and disk image containing BBench here.
Other Benchmarks
Coming soon!
Publications
If you use BBench or any of our benchmarks in your work please cite our IISWC 2011 paper:
A. Gutierrez, R.G. Dreslinski, T.F. Wenisch, T. Mudge, A. Saidi, C. Emmons, and N. Paver. Full-System Analysis and Characterization of Interactive Smartphone Applications. IEEE International Symposium on Workload Characterization, pages 81-90, Austin, TX, November 2011.

