TraceCPU
Overview
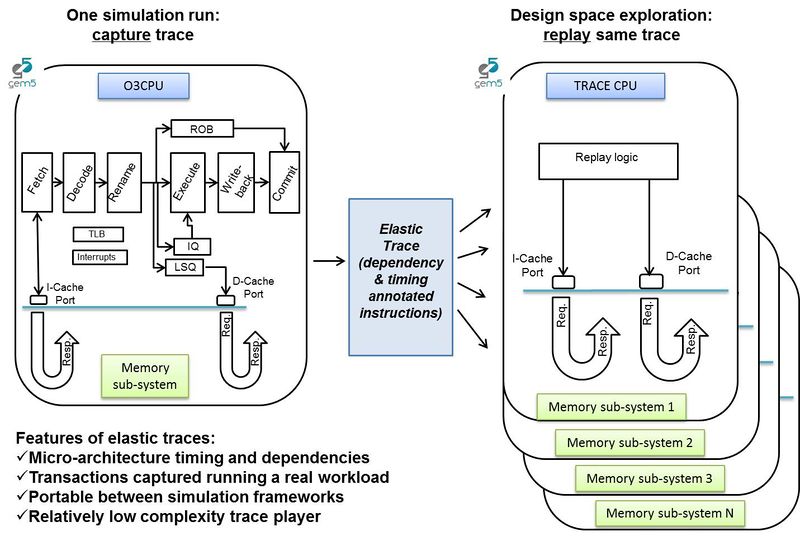
The Trace CPU model plays back elastic traces, which are dependency and timing annotated traces generated by the Elastic Trace Probe attached to the O3 CPU model. The focus of the Trace CPU model is to achieve memory-system (cache-hierarchy, interconnects and main memory) performance exploration in a fast and reasonably accurate way instead of using the detailed but slow O3 CPU model.
The traces have been developed for single-threaded benchmarks simulating in both SE and FS mode. They have been correlated for 15 memory-sensitive SPEC 2006 benchmarks and a handful of HPC proxy apps by interfacing the Trace CPU with classic memory system and varying cache design parameters and DRAM memory type. In general, elastic traces can be ported to other simulation environments.
Trace generation and replay methodology
Elastic Trace generation
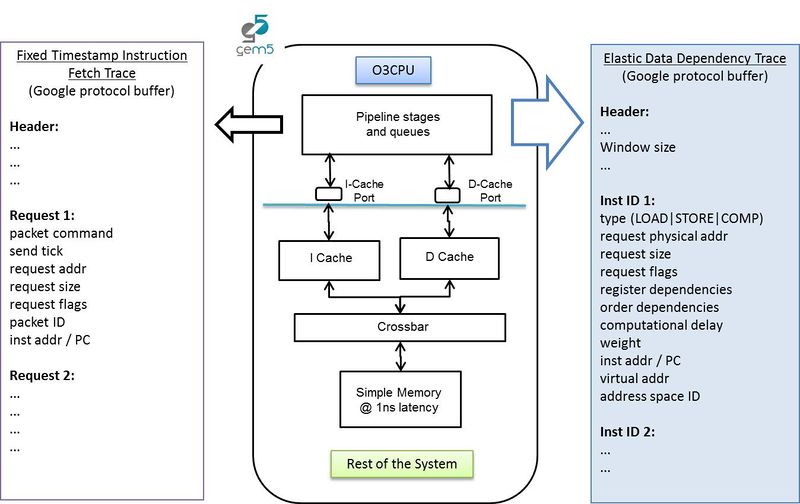
The Elastic Trace Probe Listener listens to Probe Points inserted in O3 CPU pipeline stages. It monitors each instruction and creates a dependency graph by recording data Read-After-Write dependencies and order dependencies between loads and stores. It writes the instruction fetch request trace and the elastic data memory request trace as two separate files as shown below.
| required uint64 seq_num | Instruction number used as an id for tracking dependencies |
| required RecordType type | RecordType enum has values: INVALID, LOAD, STORE, COMP |

